Tottenham have spent £1 billion less than their peers in the last decade, and this summer hardly changes that

Spurs may have splashed the cash this transfer window – but they have barely made a dent in their long-term spending deficit

Reaching into their pockets

It has been commonly understood that Tottenham have spent a great deal of money on transfers this window, much to the consternation of rival fans and Real Football Men™. After all, the club has added headline players such as Tonali, Fernandes, Van Hecke and now Savinho and Marmoush. And, after an inevitable opening day defeat at Brentford, trolls are asking if this supposedly ‘astronomical outlay’ will have any benefits.

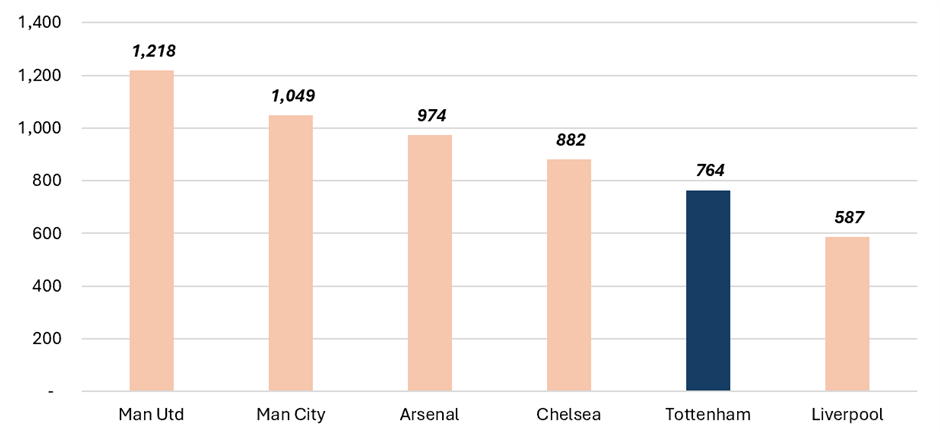
Furthermore, much of the media such as Simon Jordan continue to claim that Tottenham have “always spent big”, making this summer’s splurge seem even more egregious. The ‘net spend’ figures which are frequently bandied about seem to support this – the Spurs figure of £728m compares comfortably with the average of £894m averaged by the other five clubs.

Big Six ‘net spend’ since 2015 – 2025
Source: Transfermarkt

The reality though, is that Tottenham even now are still trying to make up for the underspend of the last decade or more. To understand exactly how much – and to gauge how much more reasonably needs to be spent, we need to peel back the layers of the figures. For these, I will stick to just the four clubs that are run properly: Arsenal, Liverpool and Man Utd as well as Tottenham (Man City and Chelsea have an entirely different business model and financial base, rendering comparisons pointless).

There are three methodological concepts needed to establish a good comparison between these clubs and I will go through each of them step by step.

Gross spend, not net spend

First, let us deal with the frequently cited concept of ‘net spend’. The reason this idea comes up is that it reflects the financial model used in computer games like Football Manager (or, if you are older, Championship Manager). In this, player purchases and sales are hard numbers coming out of a bank account, the same way that you might spend your pocket money.

However, this is not how football transfers work from a financial perspective: fees are deferred over a period of months and even years; much of it is shuffled off into working capital rather than coming out of cash (which can be funded by debt facilities); and it actually excludes cash costs such as agent fees and signing bonuses which can be substantial. More importantly, net spend is netted off against player sales, which are an entirely different business requiring different skills.

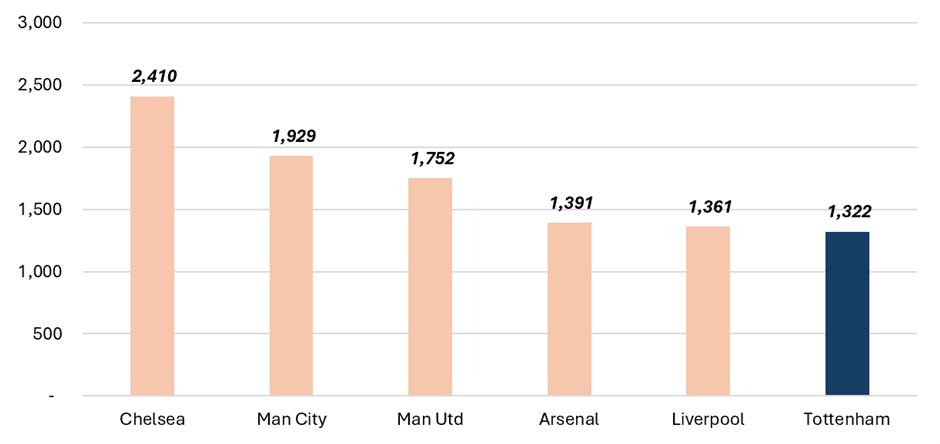
‘Net spend’ (like real GDP) is a terrible metric which has taken over as a short hand for investment. Instead, a club’s ambitions in the transfer market are really to be measured by its outgoings only (‘gross spend’) since it has far less agency over its incomings. Yes, clubs wait to offload players before signing others – but this is mainly a question of managing salaries, less about transfer fees.

Big Six gross spend since 2015-2025
Source: Transfermarkt

Judged just on this measure, Tottenham are more clearly at the back of the pack, albeit not far behind Arsenal and Liverpool. But this is only the start of the story.

‘Big player’ spend, not overall spend

Secondly, not all player signings are the same. While from a financial perspective, a £50m player has ‘cost’ almost twice as much as two £30m players, this is not the footballing reality. Most fans will understand that the £50m player will be far more likely to important than the two £30m players combined, at least in the near term. The market suggests that they are better, they are more likely to be going straight into the first team, and they are also likely to be paid much more. Player value to the team increases exponentially as fees go up, so one simple way of looking at it is to square the transfer fee to calculate relative value: the square of two £30m is about 72% of the value of the square of one £50m player. We are into the realms of pure vibes here, but most observers would feel that this is about right. This quadratic application, re-based to a £100m transfer fee, might look like this:

The likely ‘true value’ of transfer fees
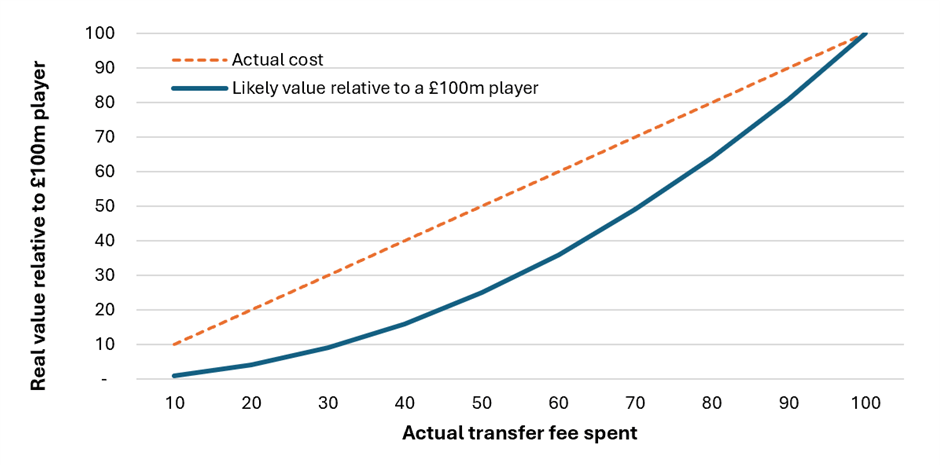
Notes: illustrative value curve assuming that £100m transfer fee = 1, ie that you get what you pay for, and therefore all other priced players are calculated relative to that – however one could choose any starting number

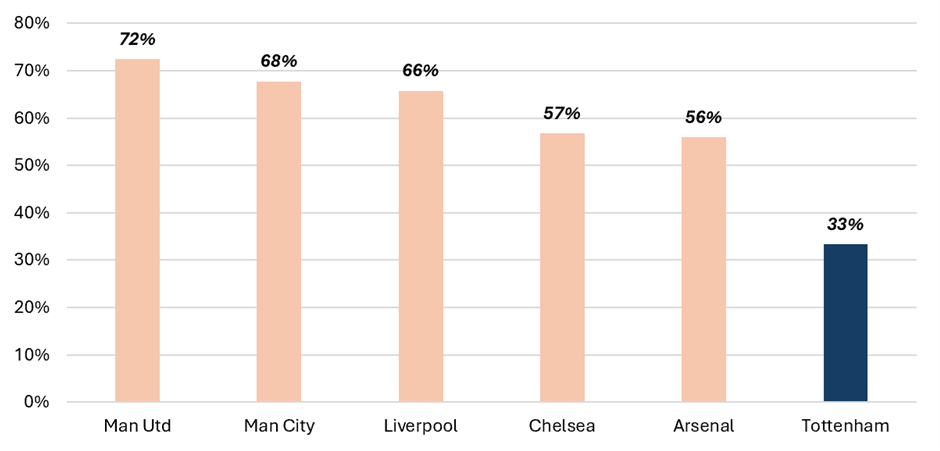
Therefore looking at spending on all players is less important than looking at spending on ‘big’, needle-moving players. One can debate what that cut-off means, but a reasonable rule of thumb is that players commanding fees of £50m or more, are generally the ones expected to play immediately and improve the first team, not just the squad. Additionally, the ‘big player’ threshold is a useful if imperfect proxy for how much a club is paying them, too.

Percentage of gross spend used on transfer fees of £50m or more, 2015-2025
Source: Transfermarkt

The problem is clear: while Tottenham have spent a fair amount of money on transfers, its spending on ‘big players’ has been severely lacking. Instead Spurs have brought in dozens of at best squad-level players (and many probably not even that). Of all the Big Six teams, Tottenham’s portion of £50m is the most off-kilter, showing a real problem of ambition.

Today’s money

Next is the matter of football inflation, which I have dealt with previously. If we look back at, say, a decade of spending by Tottenham, we cannot treat every year the same since player prices have gone up. Tottenham did up their spending in recent years, but by then the money did not mean the same. Xavi Simons cost £52m in the summer of 2025, but the same amount spent on Aymeric Laporte by Man City in 2017 was clearly a lot more in real terms. In order to compare apples to apples, we therefore need to adjust fees for inflation.

Taking into account the £50m number as the needle-moving transfer fee, and looking back, this number reduces over the course of the last decade such as £50m in 2026 is about £41m in 2021 and £36m in 2016. Therefore, to compare real spending, we have to look at ‘big players’ in today’s money.

What £50m looked like in money of the day, since 1992
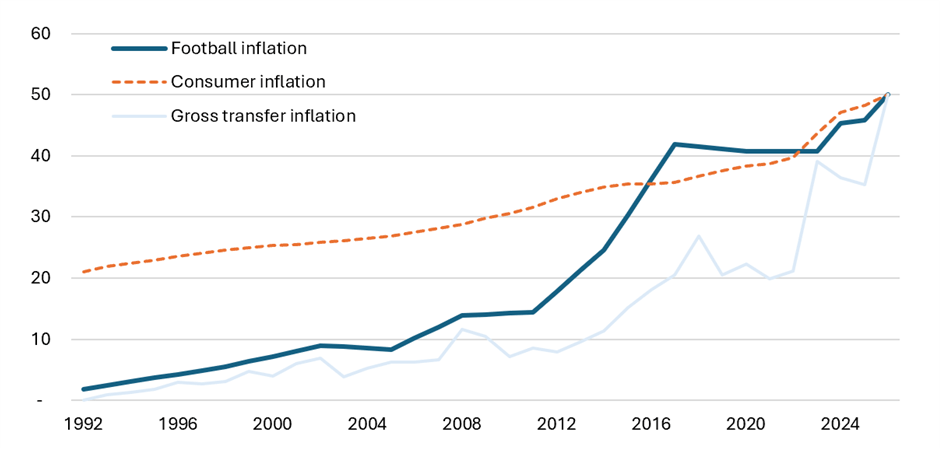
Notes: Football inflation calculated based on value of TV rights as per previous blog. For completeness, the implied inflation based on total Premier League actual gross spend annually since 1992 is also included, which has a 0.92 correlation with TV rights inflation but is more volatile and I feel less indicative of club management forward views affecting player prices. CPI from ONS.

Tottenham’s spending deficit

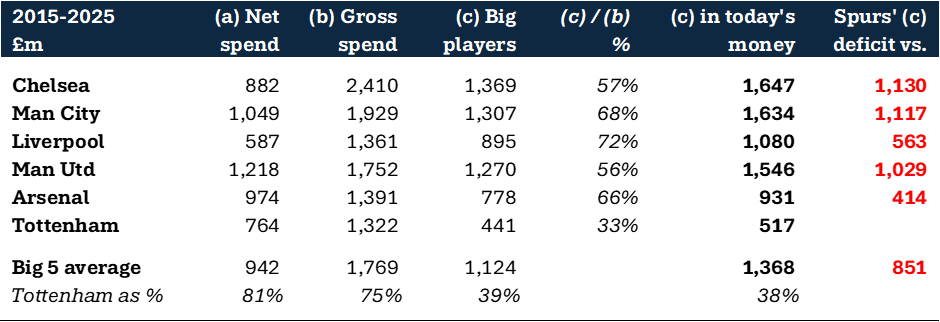
Until this summer, then, and even with the wallet being unleashed a little under Levy’s last window in charge, Tottenham over the last decade has underspent the rest of the Big Six by some £850m on average. To even catch up with the nearest spending rival, Arsenal, Spurs needed to spend more than £400m; but to catch up to, say, Manchester City, they needed not much over £1.1bn of new players. (I leave Chelsea out of this conversation for now simply because their business model under the current ownership is not the same.)

Big Six gross spend on players worth £50+ in today’s money 2015-2025 (£m)
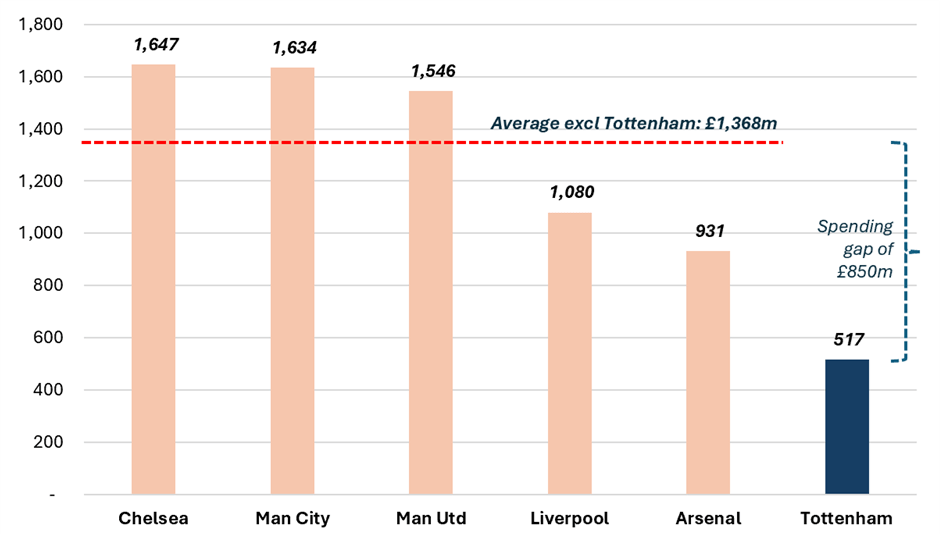
Source: Transfermarkt with inflation adjustments, full numbers below

To do this is tricky. First, it is impossible to spend so much in one transfer window at all, let alone do so without creating artificial price inflation because everyone knows you are doing so. Secondly, the figure shifts since the other teams are themselves spending more – Tottenham’s catch up spending needs to be net of new spending from the other clubs this summer. Lastly there is the softer elements, for instance how well Tottenham’s scouting and player assessment is compared to clubs which have been better run for so much longer, and whose infrastructure has been maturing for a decade. Tottenham struggle with both value and quality in trying to make up for lost time, as any club would under these circumstances.
So yes, Tottenham are taking the requisite steps to make up for a lost decade of transfer activity. While we would all love to believe that success on the field could come from elsewhere, it is impossible to maintain a ‘Top Six’ status without spending being broadly in-line with the others. And while we can be very excited about the £300m+ invested this summer, this does not even put us top of the Big Six (Chelsea’s gross spend is almost £400m). There is still a long, long road ahead before we make up for the lost time relying on a few over-performers such as Kane and Son. Whether the Lewis family can maintain the appetite for this, is anybody’s guess.

Just how rich is Tottenham Hotspur, really? Not very.

Daniel Levy

With the virus having suspended football, this seems like a good moment to finally sit down and look at exactly how “rich” Tottenham Hotspur is as a football club, and therefore think about the question of how much we can afford to spend.

The Swiss Ramble recently performed its annual analysis of Spurs’ finances, and it is an exercise I like and admire very much since it attempts to put into perspective the club’s performance and context amongst the elite. Yet it has a major limitation, which is that it focuses almost exclusively on “profitability”, as this excerpt shows:

Swiss Ramble

Source: Swiss Ramble twitter account

The problem, of course, is that profitability tells us very little about cash available, since the items on the P&L (including the profits after taxes) are mostly not real cash items. Instead they are filled with such concepts as depreciation and the gains recognized on the sale of players as assets. Essentially, these are accounting items. And I find it a dangerous way to look at a football club because it raises false expectations about how “rich” we are and therefore how much we should be able to pay for transfers.

I prefer to apply a financial perspective by looking at football clubs as one would any other business, through the company’s balance sheet and cashflow statements. The balance sheet gives us a sense of how indebted the company might be. But more importantly I like to look at the cashflow statement for a few reasons:

  1. Real cash items – the cashflow statement gets rid of non-cash items such as depreciation and replaces it with real cash such as capex
  2. Transfers – it more accurately captures the actual money going in and out on transfers including all hidden costs as well as payments spread over time – a £60m fee paid over three years should be seen as such and not lumped into one number
  3. Stadium investment – it captures all hidden costs but also allows for financing raised against the project, ending the “the stadium pays for itself” speculation.

Helpfully most financial accounts break down transfer spending in quite some detail, which in turn allows for me to get to my core concept: the pre-transfer free cashflow (“PTFCF”). For this I take the net cash inflow / outflow, and add back transfer spending which I assume to be discretionary. This brings us to a calculation which tells us how much “spare” money we would have available to spend in a given year, if we had wanted to.

Taking the June 2019 figures, this metric then allows us to judge – somewhat – our performance in the transfer window.

Pre-Transfer Free Cashflow by club for year ended June 2019 (£m)

PTFCF 2019

We can see from this analysis that Tottenham came a fair way off Man Utd, Chelsea and Liverpool (and one assumes Man City, who do not publish a cashflow statement or give any notes to their Intangible Fixed Asset investments). Arsenal were the big losers of last year given their Europa League participation, and Chelsea show themselves as doing well despite not qualifying for the Champions’ League. To be clear, generating a negative cashflow (just like generating a loss) does not mean you have no money to spend; only that you must do so unsustainably out of your “savings”, which will show up on the net debt (which we will get to).

If we look at the year prior, this becomes even more stark, and highlights the fact that Tottenham, contrary to some assertions, was under real financial pressure during the stadium building process starting in 2017.

Pre-Transfer Free Cashflow by club for year ended June 2018 vs net transfer investment for the following year (£m)

PTFCF 2018

Note: Since transfer spending runs July-June and mostly occurs during the summer transfer window, a June 2018 year ending is best contrasted with the June 2019 transfer spending.

At this point, Spurs were actually incurring a substantial negative PTFCF due to stadium costs, not least since much expenditure for large capital projects is paid up-front, for land acquisition and so on. Man Utd and Chelsea spent far more than they were generating – one might say generously, “investing for the future”; Liverpool were spending about as much as they might expect; and only Arsenal were spending significantly below their capacity, buoyed no doubt by the knowledge that they were not in the Champions’ League. Indeed Tottenham’s tiny net expenditure of ~£3m was quite flattering under the circumstances.

In fact, if we look at how Tottenham have performed on average against the rest of the Top Six (excluding Man City), we have had a tenuous few years.

Three-year rolling average Pre-Transfer Free Cashflow (£m)

PTFCF 2015-2019

On a rolling three-year average, the other clubs have managed a PTFCF of around £80m per year over the last five years, whereas Tottenham, having clawed our way into contention by 2016, have actually seen the gap widen again in the subsequent years. In other words, we really are not that well-off, are some way behind the other Big Six teams, and cannot spend the money on transfers that some fans seem to believe we now should. The stadium remains a massive gamble and has to succeed as a standalone business for us to begin making up the difference with the other clubs.

To cap things off, let us just look at the “savings”. A net debt position is typical of most companies and football clubs are no exception. Furthermore, the ratio of that debt to net assets or ‘shareholders’ funds” shows the relative indebtedness of a business.

Top Six clubs net debt (£m) and gearing for year ended June 2019

Gearing and net debt

On both measures, Tottenham are more precarious than our peers. Not only is net debt larger in absolute terms, carrying with it the funding for the stadium; but alone amongst the Big Six, our gearing is at more than 100%. No doubt much of the stadium borrowing is ring-fenced to a degree, and probably operates on a project finance basis; nonetheless the cost of the debt will weigh Spurs down through interest payments for some time – and the analysis gives a sense of how much better off Man Utd really are than us, for instance. Daniel Levy, who is no stranger to this situation, will clearly not be minded to let spending get out of hand.

Some of this will be well-known and obvious to observers. The reason I raise it is the danger of football fans demanding spending beyond what is possible – and Spurs have been particularly under the microscope for this. The Swiss Ramble’s analysis – whilst perfectly legitimate and technically correct – conveys a very misleading impression over our financial clout. Headlines about record revenues and profits on the P&L, lead to questions (from those who should know better) of “where has all that money gone?”. In the end, Spurs just are not yet that big a club, and whilst I am confident that we will reach our goals, it will still take some time before we can splash out.


**************************************

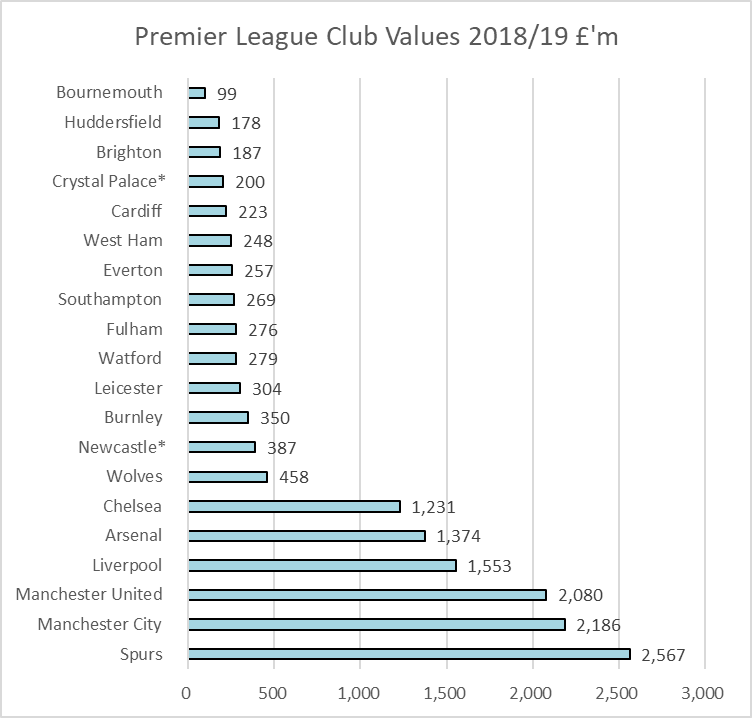
Browsing the internet after posting, I came across the University of Liverpool’s football finances website, which has recently just posted about Premier League club values for 2018-2019, which, whilst doing some equally interesting things,  has rather fallen rather into the same trap. Their proprietary “Markham Multivariate Model” is based on net profit adjusted for one-off items, but unadjusted for non-cash items. The formula is quite off-the-wall in other aspects too but I will let that lie for now.

Nonetheless it leads to what I think is just as unhelpful an output (below), saying:

Spurs overtook both Manchester clubs at the top of the table on the back of reaching the Champions League final, a fourth-place finish in the Premier League and a wage bill barely half that of Manchester United.

UoL club valuations

Even from the eyes of a purely financial investor, this cannot be true. Spurs’ true hidden value, if you want to see it this way, is the stadium value and its future earnings but as far as I can see this has not been captured by Markham. If you strip that out, however well managed our wage bill is, a DCF of Tottenham vs the other clubs would not come to this conclusion. My opinion: head in hands.