As an addendum to my previous post, I have been poring over the numbers again and it struck me as notable that the Tories, despite never having dropped below 30% of vote share in modern times, have often won fewer than 200 seats whereas Labour, despite having dropped below 30% on at least two occasions (1983 and 2010), have never breached this psychological nadir. This year, again, they were forecast initially by the exit poll to weigh in at around 191 seats, but somehow managed to scrape in at 202 in the end.
In any first-past-the-post system, the winners will always benefit disproportionately and this is as true of the US electoral college as it is of Canadian ridings or British constituencies. For instance, people complain about Trump’s electoral college over-representation in the last presidential election in 2016 but forget that Obama benefited from a vote-to-college exaggeration twice before him, as did Bush and Clinton etc. This is simply an inherent function of this kind of system, and might be considered a sort of “winner’s dividend”. However what also appears to be true is that in Britain, the Tories have traditionally always had to “work harder” for their majorities than Labour, the result of a structural and psephological imbalance between the two parties’ support.
To highlight this, I have looked at how many votes per seat each party has had to win for their large majorities, comparing the Tory landslides under Thatcher and Boris, vs the Labour landslides under Blair. Even adjusting for total vote (in 2019 terms), the Tory majorities were much harder to come by:
Number of votes required per seat won by landslide winners (thousands, 2019 basis)

Note: in order to create a like-for-like comparison, I have adjusted the raw votes per seat upwards to the 2019 total vote numbers since the electorate has grown larger in absolute terms over time
To turn this around, if we look at how poorly the losers of those elections fared, one can see how under-represented or not they are in defeat. Again, the numbers show Tory defeats being much worse than Labour ones, which manifests itself in how the Conservative Party was at below 200 seats for the whole period between 1997 – 2010, something even Michael Foot and Jeremy Corbyn have not managed.
Number of votes required per seat won by landslide losers (thousands, 2019 basis)

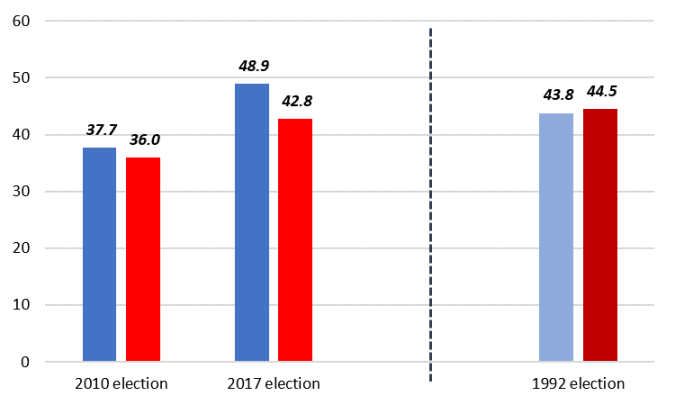
Lastly, I look at the “tipping point”, in other words how the parties fare when close to each other – for instance in the two hung parliaments that we have had this decade. Extraordinarily, in both cases the Tories, despite being the winners of each election, still had to accumulate more votes per seat than the defeated Labour Party, turning the entire concept of a “winner’s dividend” on its head. By way of comparison, John Major’s slender absolute majority in 1992 only just saw the Tories needing fewer seats than Labour.
Number of votes per seat required in close elections (thousands, 2019 basis)
At the very least this shows that the tipping point is well above the natural 50/50 threshold between the two parties. With the Tories having won a swathe of seats across the northern Labour heartlands, and with the impending promise of boundary changes, this could evolve somewhat; until it does though, Labour can relax in the knowledge that as a starting point, the electoral system still somewhat favours them.
